But anyway, the market has been obsessed with tapering lately. The Fed is buying $85 billion per month in bonds; that's more than a trillion dollars a year! If you told someone 10 or 20 years ago that this would be happening, they would guess that gold would be going parabolic. But it's not.
We can't deny that if the Fed starts tapering that there will be an impact on the markets. That would be silly. Of course there will be an impact.
But the problem with these things is that we all know that. I remember back in 2011 or so when QE1 ended; the Fed stopped buying $40 billion in bonds a month and the bond market was supposed to crash. It didn't. I think it rallied sharply (a trader bragged to me he had a huge short position on for this no-brainer, lay-up trade).
Sometimes, these no-brainers are not so easy. Gold was a no-brainer too a couple of years ago when I started this blog. But it hasn't really turned out too well for gold since then. I admit it ain't over yet, though. I have no idea what will happen to gold going forward.
So What Do We Do About Tapering?
For fundamentals-based, long term investors, should we worry about the Fed? This reminds me of a CNBC clip a few years ago where someone chased after Buffett and asked him what he thinks the Fed would do that afternoon after the FOMC meeting. Buffett laughed and said something to the effect that if he based his investment decisions on what he thought the Fed was going to do, he wouldn't have done so well.
Sure, tapering has artificially reduced interest rates. I heard someone say that the Fed thinks the interest rate is 150 basis points lower than what it would be without QE3.
If interest rates pop up due to tapering, it will impact the financial markets and it will cause some volatility. Well, so what? The markets are always volatile. Most of the time it's volatile for reasons that most people don't anticipate. If you don't like volatility, you shouldn't be in the stock market. So that's not a problem.
How about the longer term impact of higher interest rates? Well, let's put it this way. If you own a business (stock) that can do well in a 1.5% interest rate environment but would be in trouble in a 5% interest rate environment, then you simply don't own a good, robust business. You shouldn't own it in the first place even with interest rates at 1.5% or 1.0%. Likewise, if the stock is cheap only because interest rates are at 1.5% but wouldn't look so cheap with interest rates at 5.0%, then maybe it's not such a great stock. Actually, if it's a good, growing business, it doesn't have to be cheap for it to be a good, solid stock to own.
If the business you own will survive a 5% interest rate environment, then who cares? Yes, the market will be volatile. Some people can't resist getting out and trying to get back in at a later date at lower prices. Most of the Financial Industrial Complex (or maybe I should call it the Financial / Media Complex) is geared to tickle those urges (and fears) to make people DO stuff.
Some people who got out of the market before the financial crisis were too scared to get in when the world was going to end. And now they are too scared to get in because of tapering and other problems. I remember last year it was the fiscal cliff. It's so hard to resist the temptation to get out before the no-brainer drop to get back in at lower prices.
It just doesn't happen that way. I'm sure we all know people who try to get in and out like that, but nobody does it well consistently. If you look at the best track records in investing, that's just not the way it has been done.
Now, if you are Stanley Druckenmiller or some other really good macro trader, that's a different story. There are guys like that who have done well trading the big swings in the market. But they too rarely get out at the top and get back in at the bottom (Druckenmiller's performance is probably not so much from getting in and out of the stock market, but more from making huge, leveraged bets in the bond and foreign exchange markets (he said so himself!), and maybe some occasional big trades in the S&P 500 index; I doubt he calls the ups and downs of the stock markets consistently enough to be able to outperform the index just by doing that).
Debt Ceiling
This debt ceiling fear is the same. So was Syria. This is all just short term stuff that is good for macro traders, but is just irrelevant noise for the long term value investor. As even Seth Klarman said, you just have to figure out what a business can earn in five or ten years on a normalized basis and see what it's worth, and if you can buy it for lower than that (or substantially lower), then it doesn't matter what the headlines say.
So yes, despite what the pundits on TV say, I think it's OK to ignore all this stuff. Pundits on CNBC will never tell you to turn off CNBC!
Valuation
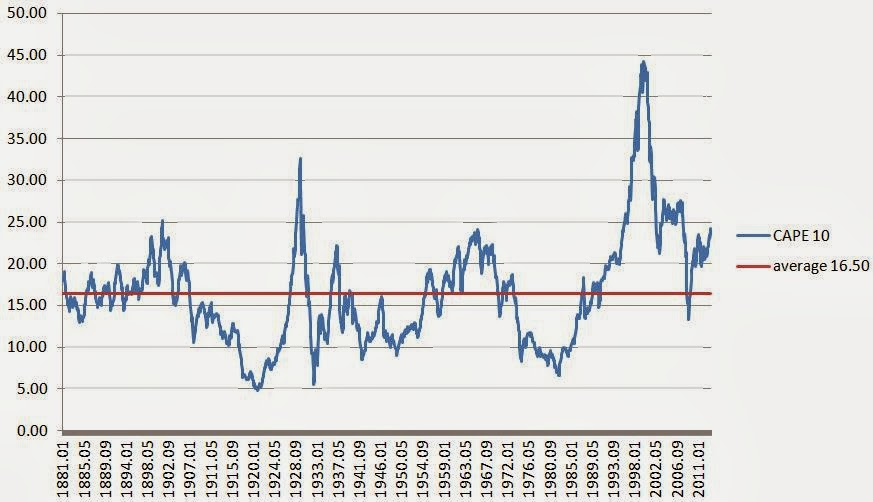
The other big fear is valuation. Commentator after commentator keeps saying that the market is overvalued, or substantially overvalued. Shiller's cyclically adjusted P/E ratio is a very popular indicator now. Here it is, direct from the Yale website:

Shiller's cyclically adjusted P/E ratio is an inflation adjusted P/E ratio. One of the key things is that it's based on the earnings of the past 10 years. This adjusts for the cyclicality in earnings; the past ten years would include good years and bad years and is more indicative of the normalized earnings power of the S&P 500. This makes sense.
And this figure is currently 24.25x versus an average of 16.5x for the whole period. That means that the stock market is currently 47% overvalued.
Yikes. I say ignore this, ignore that. But this gets my attention (which is why I spent some time on it today; plus a post was long overdue here).
This indicator seems to be a great indicator. The peaks are 1901, 1929, 1966 and 2000. Most of these seem to be horrible years to be long term investors for sure. The current level seems to be close to the 1966 peak, and we know that the Dow peaked out at 1000 or so and didn't convincingly break above that until the 1980s.
But let's not forget the Superinvestors of Graham and Doddsville. I'll borrow a table from an old post back in 2011 (Stocks no Good? (Superinvestors):

So let's time-travel back to 1966 and talk to these guys and tell them that the market is overvalued. We will tell them that they should just do something else and start their investment careers in 1979 or 1982 when the stock market will be really cheap and even idiots will put up big numbers. Not!
And these figures only go up to 1982 and the bull market hasn't even started yet!
This is what the Superinvestors essay (written by Buffett in 1984 or so) is about. They just did their thing; value investing.
For the folks now telling people to get out of stocks because of high valuation, I would like to see their historical peers. Has anyone done better than the superinvestors by getting in and out of the stock market? Did anyone really sell out in 1966, buy back in in 1982, sell out in 2000 and get back in in 2009? And even if they did would they have a better long term performance than the superinvestors?
Going back to what Buffett always says, if we think about owning stocks as owning a business rather than pieces of paper, none of this would be an issue. High stock market valuations, corporate profit to GDP or any other indicator wouldn't really matter too much.
The question would be, do you like the businesses you own? Are they well managed and priced reasonably? If yes, then who cares what some macro indicator says.
But having said all that, most of us are not superinvestors, and many people own index funds. So this valuation/chart may be directly relevant to them. The S&P 500 index is the very business that they own. And the question becomes, is it reasonably valued?
The first answer is that we have to remind ourselves that the long term performance of the stock market can only be realized by owning it throughout the whole period. The market returned 10%/year over the long term, and that includes owning it before the great crash, 1966 etc... The long term stock market return is what you earned not by getting in and out based on valuation.
I used to read a lot of newsletters (when I didn't have to pay for them; my employers had subscriptions to them all), and many had great, convincing models. When you read their stuff, it is compelling and convincing. But the fact is that none of them ever really beat the market!
Study after study show that people lose money or not do well not because they buy stocks at the peak, but because they keep trying to get in and out (if you bought stocks in August 1987, you would still be doing pretty well today, and that includes Black Monday, 1989 mini-crash, Desert Storm, Drexel, S&L crisis, banking crisis of the early 1990s, 1994 bond crash, 1997 (LTCM/Asian contagion), and two bear markets in the 2000s which included a 100-year financial crisis and 9/11).
There's a great table going around that shows prospective returns in the stock market depending on the stock market p/e ratio at the time of purchase. And it's a compelling table. It makes perfect sense. The cheaper you buy the index, the better your returns over time. The higher the price you pay, the lower the prospective returns.
And yet, I have really yet to see anyone who has put up a great track record using that simple logic. The table looks great. But where are the Superinvestors of Convincing Tablesville?
What we are hearing from pundits is the same every time. The market was very obviously bubbled up back in 2000 but I don't really know anyone who nailed the downside; they kept trying to call the top for so long in the late 1990s that by the time the bubble finally popped, very few people were still short. Very few. Even Stanley Druckenmiller didn't play that one well (and if the greatest trader of all time didn't get that right, who are we to think we can do it better?!). I think it was similar in 2008/2009 too. It wasn't as obvious as 2000, but once the problems started happening, it was pretty obvious that the market was going to get into some trouble.
But I think very few people actually were able to make money off the short, or even get in on the lows.
No matter how compelling charts and tables look, it's just not that easy to get in and out of markets, or to make money trading it. Seriously. I've been watching people (and trying myself sometimes!) try to do it for years and most of them are better off just ignoring it all and just owning an index fund or a basket of good businesses that they like.
A Closer Look at the Shiller P/E
Having said all that, and having told you to ignore it all, let's take a look at this Shiller P/E ratio. I took the raw data from the Yale website to create this chart so we can see the Shiller P/E by itself.
The average for the whole period seems to be around 16.50x, and the current level is 24.25x. Now, here's the thing that has nagged me about this for a while:
- What does this chart look like if you exclude the financials? The financial crisis really distorts this figure because of the huge losses in the industry in 2008/2009.
- The 24.25x p/e ratio is supposed to represent a cyclically adjusted p/e ratio. This would be correct if we assume that the financial crisis of that magnitude is expected to occur every ten years! I highly doubt that is the case. I tend to believe (and not as an excuse for the CEOs that blew up) that it really was a once in a hundred year event. If that is that case, then the cyclically adjusted p/e ratio would be too high (and normalized 10 year earnings understated). Sure, some of that is offset by a huge credit bubble going into it; a lot of money was made during the bubble years and the 10-year p/e includes that too. But it seems like the crisis blew away a lot more than was excessively made in the bubble years of 2005-2007. I have no evidence to support that; it's just my guess and it's not a major point of this post anyway (even though I thought it might be!).
So just for fun, I decided to take a look at the non-cyclically adjusted (but inflation adjusted) p/e ratio using the same raw data:
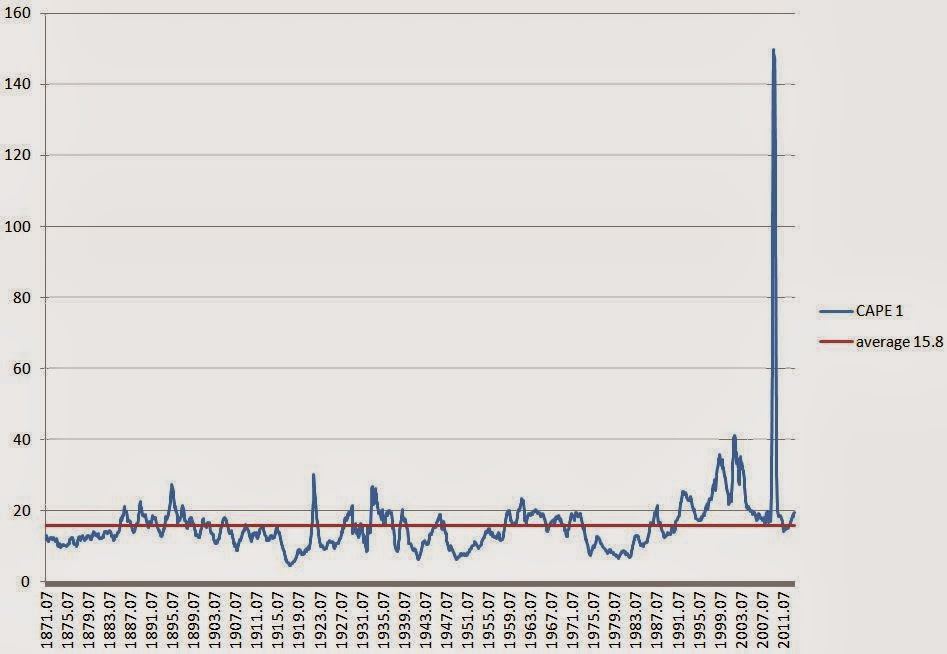
So you can see how the p/e ratio popped up to over 140 during the crisis. I am not saying something like that won't happen again. I just doubt it is something that will happen every 10 years.
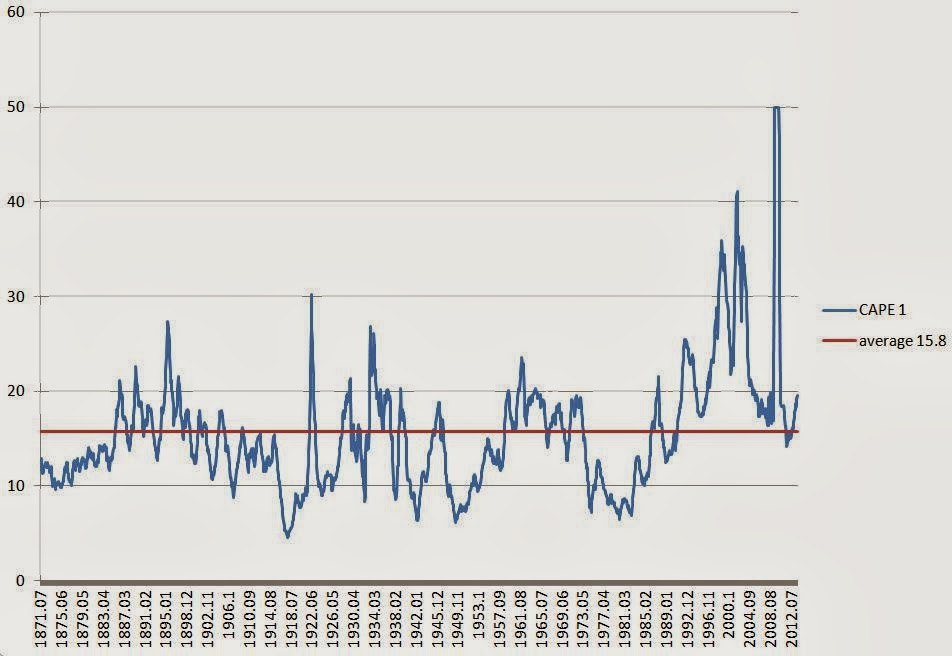
I redid the chart but capped the p/e at 50 so we can see the chart better. This doesn't effect the average; the average was calculated using the raw p/e ratio.
I know there is an argument that earnings are above trend due to the high margins some data show and the fiscal deficit and QE3 are pumping up the economy (and therefore corporate earnings) over normally sustainable levels. So in that sense, maybe current earnings are peak earnings levels for this cycle. In that case the market might be really overvalued.
The current 19.6x p/e looks like it overvalues the market a little bit. I know that the tables tell you that owning stocks when p/e ratios are high gives you lower returns, but just eyeballing the above chart, it doesn't look to me like the current level is necessarily "get out now!!!!"-level either.
I did looked at this wondering what the Shiller P/E would look like in the future when the big losses from the crisis suddenly drops out. It looks like it may go down a little bit, but maybe not as much as I thought as we are already at 20x p/e even if we maintain current earnings for the next ten years.
In any case, think of any investor you respect. I'll just go back to Buffett (even though he's not a good example as he is such an outlier; he would overcome a lot of headwinds!). The question becomes, would Buffett have been better off to lighten up on his holdings when the CAPE 1 is close to 20x p/e? Despite what the tables tell you, would any decent equity investor have been able to improve performance by lightening up their holdings every time this chart showed a 20x p/e? And then what level of this p/e would they have to wait for to get back in? For that matter, look at the original Shiller p/e ratio (CAPE 10) and make the same argument. Which decent value investor would have been better off by adjusting portfolio exposure according to this metric?
Tables and charts can tell elegant stories. But to actually turn that into a good performance is another matter altogether.
Conclusion
None of this is to say that the markets won't go down. It will go down. There is no doubt about that at all. The question is when, and by how much? Anyone can call a crash or a bear market. But not many will be able to exploit it.
I say ignore this and ignore that, but I only mean that in the investment sense. If you are looking at something and see a stock that is trading at 1.1x book that should be trading at 1.5x book, go ahead and buy it! Who cares what the market p/e ratio is. That's what I mean.
And it's good to be aware of these things that people talk about and are worried about. I don't advocate sticking your head in the sand. I only advocate acting rationally and resisting the urge to do stupid things (like accumulating index puts in front of a possible debt ceiling debacle, shorting treasuries in front of tapering, or lightening up on stocks because of a possible problem in Syria etc...; the problem is that you may not be the only one doing so!).
So what to do?
- If you own individual stocks, review them and make sure you like them. If you don't, or aren't sure, you'll feel horrible when it goes down 30% or 50%. And you would sell out in fear. If you really like it, you should be able to hold it through the storm and not blink. As someone said about guiding the ship by the lights from a distant lighthouse and not the waves crashing against the boat, just make sure the business will be doing well in five or ten years (and hopefully doing a lot more business). If so, sit tight.
- If you have stuff in your portfolio that is not high conviction, or even stuff you bought as a punt or on a tip, now is the time to clean house. Dump that stuff. You got lucky. Now dump that stuff while the tide is lifting all boats.
- If your portfolio went down 50% tommorow and you would be upset, then that means you own too much stock. Sell down to a level where you won't lose sleep if it went down 50% because it will at some point. OK, to say that it will happen in one day is a bit extreme. This is Joel Greenblatt's idea; the mistake people made in the financial crisis is not that they didn't sell before the crisis, but that they owned too much stock and they freaked out and had to sell in the decline out of fear. If you were comfortable with stock market volatility, you wouldn't have sold out and you would've been fine (unless of course you owned too much of the ones that went bust!).
This is the sort of thing I would advocate doing. What I would NOT advocate doing is doing something to your portfolio just because Stanley Druckenmiller said that the markets will correct when the tapering begins, or because some charts are starting to look a little scary (Shiller p/e).
I know I haven't really made the case here that the market is cheap or fairly valued or anything like that. It does seem overvalued either way you slice it. I suppose on forward earnings the market looks fairly valued, but we all know about the accuracy of analyst estimates whether top-down or bottom-up.
I was just playing with this stuff to see for myself what's going.
It's important to remember, though, that just because the market level is not cheap doesn't necessarily mean that you shouldn't own stocks! It's nice to buy stocks when the market is really cheap for sure, but that has only happened very rarely in history. Again, the 100 year performance in stocks includes holding through a 7x p/e and 30x p/e market!
If you only bought stocks when the whole market was cheap based on the Shiller p/e, you may have only bought in 1920, 1932 or 1982. If the market was at average valuation, you might hear the argument that the market doesn't bottom out until the valuation goes well below the average. In fact, I did hear that argument after 1989, 1990/1991, 1994, 1997, 2002, 2009 etc... (that the market won't bottom until the p/e gets to 7x like it did in 1932 and 1982).
You wouldn't have bought any stock since the early 1990s since the Shiller p/e would have been above the historical average (well, I am just eye-balling the above chart; the average up until the early 1990s would not have been the same as the average shown above!).
etc...
You get my point.
Good post, I think you have some great advice in there. When the market becomes more overvalued, I think a value investor's opportunity set decreases and this can naturally lead your portfolio to holding some more cash as there are less good ideas out there. The likes of Tweedy Browne have and I think are currently, tilting more towards a heavier cash holding for this reason. I've always thought this is a nice way to look at market valuation and by managing your portfolio at the individual stock level (micro) you almost form a view at the whole portfolio level (macro) without having to actually look at the CAPE ratio etc. This is of course what you allude to in the post! If there are less good ideas out there (probably due to market overvaluation), hold cash until there is. But then don't be afraid to buy something in times of market overvaluation. Looking at the US market overall, I believe other good measures of valuation also indicate the market is overvalued. Tobin's Q Ratio and Buffett's favourite measure, market cap to GNP, also show the market is in overvalued territory. Thanks, Tom
ReplyDeleteDoes it make sense to calculate the average right from 1870's.
ReplyDeleteI think an average of Shiller PE for the last 10 years would make more sense. Can you please post that.
What if you take a median instead of average, will the numbers change significantly?
Hi, the median for the CAPE 10 would be 15.9x versus 16.5x.
ReplyDeleteThe ten year average of the 10 year p/e is 23x, so the market is trading around what is has traded for the last ten years. I think people will argue that this included a period when stocks were highly valued most of the time. Going back to 1870 has many problems too due to changes over time, but it does cover many cycles so I don't think it's a bad idea to use the long term average.
Thanks for reading.
I'd be more interested in seeing a Shiller EV/EBITDA.
ReplyDeletebottom line, Bogle wins ! thanks.
ReplyDeleteAh, but only partially. Bogle doesn't think people can beat the market but the Superinvestors of G&D prove that they can. But yes, indexing as Bogle says is better than buying and selling the market according to scary looking charts, tables and things like that...
Deletehave you seen the article in the JOI on creating global CAPEs for all the countries in the world?
ReplyDeletehttp://www.indexuniverse.com/publications/journalofindexes/joi-articles/16017-global-value.html?showall=&fullart=1&start=8
Thanks for that. That's cool. It would be great if someone had that updated for all countries around the world like Shiller does for the U.S. Thanks for reading.
DeleteWhat's the best way to value an alternative asset manager like Oaktree? What are your thoughts on how rising rates will affect their business?
ReplyDeleteI made some posts about Oaktree in the past so you can see how I think about it. People seem to value the fee-related earnings stream at 15-16x p/e and then the incentive fee stream (net of bonuses) at 5x or some such.
DeleteBut these days if you look at the private equity managers' investor presentations, they are using a p/e multiple on economic net income and comparing that to the regular p/e ratio of traditional asset managers. I don't know how directly comparable that is as the p/e ratio is net of corporate tax but economic net income is pretax (some taxes paid, though) as it is a partnership and taxes must be paid by the LP unitholder on income whether it's distributed or not. But then you can argue that the p/e ratio of traditional managers are after corporate tax but if they paid all of that out as dividends the stockholder would have to pay tax on dividend income.
In any case, it would be some multiple of economic net income; but be careful as Oaktree and others are realizing a lot of gains these days so profits booked in recent quarters may not be 'normal'.
Great points.
ReplyDeleteHowever, it's curious that Buffett himself earlier this week opined that the market although not cheap, is not overvalued either. And he has stated that several times this year. I wonder what it is that he is seeing that others aren't.
Yes, Buffett is not the only one. Howard Marks keeps saying that too. Meryl Witmer said it too. As I said, if you look at forecast EPS, then it is reasonable-looking.
DeleteThis is the problem with these 'macro' figures. The CAPE 10 makes it look like the market is 50% overvalued, but for example, I really like JPM and they are trading near book value. I don't think JPM is only worth 66% of book value. I like other financials and I don't think any of them are only worth 0.66x where they are trading now. KO is 20x trailing p/e, and I don't think they are only worth 13x p/e. I think they are trading at 16x next year's earnings, and I don't think they are worth only 11x p/e.
So this is the problem, as I mentioned when I looked at corporate profit margins in an old post a while back.
This is why I wish we can see more of the inside of this 'macro' data; what sectors may be skewing the data? Where is the overvaluation specifically? etc...
I guess it's another reason to 'ignore' these things...
>So let's time-travel back to 1966 and talk to these guys and tell them that the market is overvalued. We will tell them that they should just do something else and start their investment careers in 1979 or 1982 when the stock market will be really cheap and even idiots will put up big numbers. Not! ... This is what the Superinvestors essay (written by Buffett in 1984 or so) is about. They just did their thing; value investing.
ReplyDeleteBuffett himself closed his partnership to new money in 1966 and then liquidated the partnership entirely in 1969 because the market was too expensive then. Then he started buying again in 1970 after the market crashed. Good to see people thinking back to the 1960's, because that is what today's market is like. Not 1929, not 1999, but more like 1968 or 1973. Or 1967 or 1966 or whatever. Sure, if you're Walter J Schloss buying penny stocks that no one ever heard of but which happen to be diamonds in the rough, then it really doesn't matter what the broad market indexes do. But for those of us buying index funds and broadly diversified ETFs, this is a very dangerous market.
Yes, that's right. It is possible we are in a 1966 - 1983 period but we really can't know for sure; that's the problem. After 1987, some very smart people were convinced that we were going to track 1929-1932. A lot of things were eerily similar and there were a lot of fundamental problems back then (twin deficits etc.).
DeleteThe year 2000 was even worse than any other period in terms of valuation but there was a lot of interesting stuff to do in stocks even since then (Buffett's new managers made their track records during this period). For indexers, yeah, it wasn't a great period since then but the point is that in order for someone to have realized the equity returns over the past 100 years or whatever, they would have had to endure the long flat periods that usually occur in the market. Of course if you knew when the markets would be flat and when there would be a bull market, then it is obviously better to get in and out, but the historical record seems to show that that is a hard thing to do (even if Buffett did it once).
But yes, I agree it's a dangerous market, but trying to time is dangerous too!
>But I think very few people actually were able to make money off the short, or even get in on the lows.
ReplyDeleteI don't do short or leveraged long, because, as Buffett puts it: "You only need to get rich once, that's sort of obvious", with the implication that only a fool takes big risks once he's rich. However, I did get in on the lows several times recently. Like Buffett, I went from 100% short-term treasuries on Oct 9, 2008 to 100% stocks on Oct 10. Then I sold on the bounce and bought back again in Nov when the market crashed to 750 on the SP500 due to the Citibank scare, then popped the next day when the news hit that Citi was going to be bailed out. Then I sold out again on the hunch that the Obama inauguration bounce was going to be a flop instead, and bought starting at 750 as the market fell through Feb 2009. My average price was 730 by the time I hit 100%. Then I sold in April of the next year. I missed the summer 2010 crash because I got greedy and kept waiting for the SP500 to break 1000. Luckily, I was given another opportunity in Sep 2011 and I bought then at an average price of under 1100. I started selling when the market went over 1450 and am down to 20% stocks now (with the rest in intermediate-term bonds, I'm really happy with the munis I bought this summer, BTW). I'm expecting at least one more crash before when finish this long cycle of sideways movement that began in 1999, and I'll trade back to 100% stocks when that occurs. Market-timing is not that difficult. The key is that you have to sell when prices are good (like now) or you can't buy at the bottom. The reason there isn't a huge amount of buying at the bottom is not fear or incompetence (at least not with smart investors) but rather because they are already 100% stocks, or otherwise have liquidity issues.
"Don't sell at the top, can't buy at the bottom" is the corollary to "Don't buy at the bottom, can't enjoy taking profits at the top".
Good for you. I made some good moves to in the recent cycle. I don't know that picking tops and bottoms in the recent past is enough evidence that it is 'not difficult'. If you can do that consistently over ten or twenty years, you will do very well, but I happen to doubt it. I've seen people get a couple of turns right. Newsletters tend to be like that too. They can be hot and spot on for a few turns, but over time tend not to be so accurate.
DeleteIf market-timing is really not that difficult for you, hedge funds will pay serious money to you so you should send your calls to prominent hedge funds; if they notice you are right often enough you might get yourself a job!
Anyway, thanks for reading and good luck!
By the way, I didn't include it in the post but to illustrate the difficulty of timing the market even using valuation, I was going to point out the many calls in 1996-1997 that the markets were seriously overvalued. If you look at the CAPE 10, you will see that it went up to 24x back in 1996. This was around the time (maybe it was 97) that Greenspan made his irrational exuberance speech. If you sat out the market then because of that, you wouldn't have ever really gotten back in as the market has been expensive since then, pretty much. And since 1996, despite the internet bubble crash and the greatest financial crisis since the great depression, the market is still higher.
DeleteSo it's easy to look at these charts and say, gee, it's so simple. You can just buy stock here and sell it there... But in real time, it's really not so easy as it looks even if we do get some calls right now and then.
I have made some great calls myself, but what I made or saved on those calls pales in comparison to how much I made by picking the right stocks!
>If your portfolio went down 50% tommorow and you would be upset
ReplyDeleteI keep hearing this rule and it is dumb. Of course I'd be upset if my stocks went down 50%, never mind my whole portfolio and so would you and so would anyone. I'd be upset if my wife cheated on me too, or if my dog peed on the carpet. The point is what do you do when things happen that you don't like. Kill your wife? If so, you go to jail or the electric chair, depending on jurisdiction. Hang your dog? If so, you might end up doing time Michael Vicks and also lose the respect of all your friends. When stocks go down, the rational thing is not to sell them but rather to BUY MORE. Same as if you bought tuna fish for $2/can because that seemed like a good price and then saw it on sale elsewhere for $1/can.
Well, maybe I didn't phrase it right. What I meant is that if it's gonna freak you out when the market goes down 50% and you're going to panic and sell out, then you own too much stock. Buffett says that if it will upset you if a stock you own went down 50%, then you shouldn't own stocks as stocks will inevitably go down 50% at some point.
DeleteThis is not such a dumb rule as it applies in trading and poker too. If you are betting such large sums that a loss would be bother you too much, you won't be playing your best; you would be playing out of fear and nobody plays well like that. Same in trading. If you have a position on that's so big that you can't sleep at night, you are not going to make good decisions when the trade goes against you.
So the rule is right. Maybe the way I wrote it was dumb!
Anyway, thanks for reading and commenting.
Hi. I’m Ruben from Spain. Sorry for my poor English. I agree with you that bottom-up is what really matters (at least, in the long run!). In talking about CAPE you say “it seems like the crisis blew away a lot more than was excessively made in the bubble years of 2005-2007”. But in fact, as Cliff Asness demonstrates, good years were far more than offset bad ones.
ReplyDelete(http://greenbackd.com/2013/04/01/aqrs-cliff-asness-on-an-old-friend-the-shiller-pe/).
Ruben again. Good years offset the bad ones. Sorry :-(
DeleteThanks. That's a good analysis. I guess we are way above trend no matter how you slice it. I figured that since the trailing 12 month is also at 20x p/e (which excludes financial crisis losses and boom year profits; the last 12 months is a slow 2% growing economy so not boom or bust).
DeleteBut I sort of still don't get it cuz I find it hard to believe stocks I look at are 50% overvalued. As I said in one reponse above, financials are at book value and I don't think they are worth way less. Many blue chips are 15-20x p/e, and I don't see them necessarily as worth way less...
So I would love to see the inside of all that and see which industries and companies are making these figures look like this. We know what skewed the p/e figures in 2000, but frankly I don't know what's making it so high now.
Anyway, thanks for posting. We have to be mindful of all this stuff...
Great Post. I would add that most who are reading this blog are reading it for stock/business/valuation insights. For us dyed in wool value investors, cash is usually a residual from lack of investing opportunities. I did take a big hit in 2008-2009, but the same portfolio more than tripled the SP500 return going forward. The take away for me was to always have some cash on hand. Kind of like Pabrai reserving his last 10-20% for potential 4-5X opportunities
ReplyDeleteCR
A few random thoughts...
ReplyDeleteWhen you calculate the average (or median, the results are similar) CAPE between 1870 and 1982, say, you get a lower value. Around 14.5 if I remember correctly. Which would mean that the market is a bit more out of whack than it seems. Now why could this be ? One reason imo is that since 1982 we had kind of a goldilocks scenario for stocks. Interest rates were going down (from 15% to basically 0%) and total debt (financial debt plus household debt) was inceasing. Jim Reid from Deutsche had a nice chart showing GDP and total debt since WWII. What you could see is that those two grew in lockstep until the early 1980s, then debt went through the roof and it is still not back to trend yet (in his chart it was about halfway back but that has been a year or so ago, maybe even more). So it *might* be that an average / median CAPE around 16 is still a bit too high and we face more downside.
I know that Marks says the market is fairly valued but I cannot follow his arguments. GMO and Hussman as a cross-check say that propective long-term returns are somewhere in the low single digits which is way too low imo. And there is Buffet in the back of my head saying that you cannot reasonably expect that profit margins stay way above 6% of GDP (which would be needed indefinitly to make todays TTM P/Es reasonable).
I know you keep pounding the financial stocks and yes, I think some are still reasonably cheap or at least not on the expensive side (JPM, BAC). Bear in mind, however, that a lot of seemingly solid shops had near-death experiences in 2008/2009, so ordinary folks who have no inside knowledge of the financial industry might not touch them with a 10 foot pole (as a matter of fact I know a bunch of financial professionals who wouldn't do that). There *might* be still a lot of fear around which could be part of the reason why these babies are not overvalued yet. As for the more "productive" industries, I for myself struggle to find some good value at a reasonable price. But maybe it is just me.
Fully agreed on market timing. I think it is difficult to impossible to pull this off in a consitent manner. Some guys in the high frequency space may be able to do so but even they are only right on average and have pretty large samples. Not what we low latency guys have.
Cheers,
Eddie
Thanks for posting. Those are all good points and I am familiar with most of those arguments and don't disagree. One thing that Goldman used to show was the p/e ratio average with differing interest rate levels. I don't necessarily believe in the Fed model (which would call a 50x p/e ratio market fair with 2% long term bond yields), but rate levels is one factor that lead some to believe the market is fairly valued. I don't buy that it's cheap, though.
DeleteThis is not meaningful for most of us who think that interest rates can't stay down here for too much longer.
But the other side of the normal scenario is the Japan scenario which is still possible. In that case, rates can stay a lot lower for a lot longer than people think. And it has sort of been that way.
Of course, a lot of it is due to QE3, but if we are indeed overindebted and we can't expect higher growth, then interest rates may not go back up as much as we think even if QE3 goes away.
In any case, I do read all the arguments about market valuation. It is interesting to me and I don't mean to say they are meaningless or anything like that.
But you know, the folks who focus on that sort of thing and keep showing us those graphs and charts tend not to have any performance figures to show! I don't want to name any names, but you know those guys screaming and yelling on TV about this or that, about the debt, about the market, U.S. dollar and all that have done horribly over the years. (Of course, there are many great investors who complain about the same thing, but those guys tend to talk about the problems but have a different investment approach that allows them to make money regardless...)
Anyway, thanks for reading.
The Fed model doesn't make sense imho. Equities provide a longer stream of cashflows than bonds, so the duration must be much longer. Apples and oranges as far as I can see.
DeleteMy personal guess is indeed that rates will stay low for some years to come and Blackhack Ben also pointed to that. This has been discussed like a gazillion time, I know, but can the Fed become insolvent (I guess so) ? What happens if it does ? I don't have a clue here, so any insight would be appreciated (I only know that the central bank of Costa Rica was insolvent for a couple of years and nobody really cared).
Deflation is what keeps me awake at night... and I think we are not out of the woods yet. Funny enough that my favorite one-trick pony when it comes to deflation (no names here) turned around lately and said inflation might be the bigger issue (after writing a book about the deflationary years that will come). Anyway... Prem Watsa had some thoughts about deflation in case you are interested (and also acted accordingly).
Fully agreed. What I had in mind was some simpler stuff, like dividend income, dividend growth and growth of corporate profits adjusted for the cycle (be it CAPE, peak to peak, whatever, the results don't vary a lot). So simple in fact that even I can calculate it. No matter how I turn it, yields for a buy-and-hold investor in stocks, the S&P 500 say, are pretty low. Probably reasonable given the low interest rates but in absolute terms still low. I'd rather own treasuries here.
Eddie
Thanks! Ive been waiting for you to write on your blog for a while now:P
ReplyDeleteI won't dismiss CAPE10 because the GFC was a once in a hundred year event.
ReplyDeleteIf GFC was indeed a once in a hundred year event, so were extraordinary profits corporates earned preceding it. So, in CAPE10, the period preceding GFC and the period after GFC will cancel out and normalize each other. I think the whole point of CAPE10 is not to exclude extraordinary periods.
Is that QE is started having effect? All that currency printing has to inflate most of the assets one way or other. And the bond buying is still going on. No talk of tapering yet. I have a fear that value investors who will stay out of the market now will stay out for long long time. This bubble is gonna go up quite a lot.
ReplyDeleteHi, nice blog. Well you asked what makes this market skewed, what made the P/E get so high. It was, and still is, the bullmarket hysteria in the IPOs and then Biotech and Nasdaq. Very big larce cap Biotech like Gilead and others are crazily valued, you have plenty of S&P Stocks and NasdaQ stocks with crazy multibillion dollar valuations. They all get the s&p 500 numbers skewed a bit. I see some things the same like you. Good old economy stocks are not crazily overvalued like KO (even Buffett said that he should have walked when he just talked ---> KO p/e over 40 at the 1st NasdaQ Bubble in the 99-2001 timeframe). Bye, bye from Germany.
ReplyDelete